P50 28s Analyze →
SHEET 01 · /// LIVE POSTGRES 11–17 · MEDIAN 28S · 2026 EDITION

Paste slow Postgres SQL.
Get index DDL + rollback
in ~30 seconds.

Drop your slow SQL or EXPLAIN ANALYZE plan into the panel below. We classify the shape and return a markdown review with index DDL, write-path cost, p95 estimate, and rollback. Median 28 seconds. No row data leaves your network — schema text and query text only. New here? See a sample DBA review or read how we analyze EXPLAIN plans.

INPUT · SQL OR EXPLAIN QD-DEMO · LIVE
16 preset · run · esc clear
OUTPUT · /r/QD-DEMO PG15 · 2026-05-02

// Paste a query in the left panel — or pick a preset — to render a review here.

SHEET 02 · SAMPLE REVIEW

What an actual review looks like.

REV. 2026-05 · QC PASS
/r/QD-1042 Sequential scan on orders 26.4s · PG15 · Aurora

Bottleneck

Sequential scan on orders (12.4M rows, 38 GB). Predicate (status, created_at) is applied post-scan. The single-column index on created_at is technically eligible but the planner walked it backward, then filtered 11.6M rows in memory.

The OFFSET 0 LIMIT 50 shape is a tell — keyset pagination would help, but the index choice is the bigger win first.
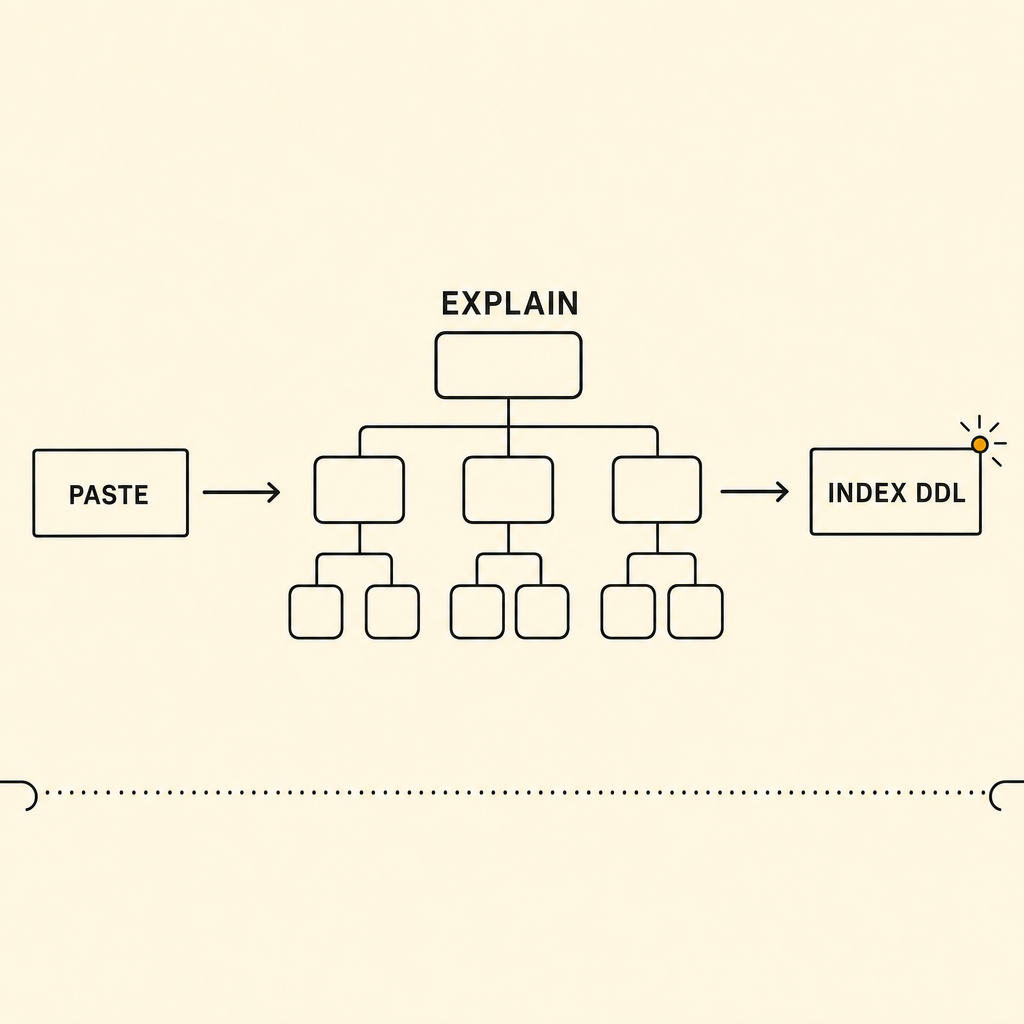
EXPLAIN node trail

-- the slow path Limit (cost=0.00..1234.50 rows=50) → Sort (cost=0.00..15234.10) Sort Key: orders.created_at DESC → Seq Scan on orders (actual time=0.011..1812.4 rows=11.6M) Filter: ((status = ANY (...)) AND (created_at > $1))

Recommendation — partial index

CREATE INDEX idx_orders_created_at ON orders (created_at); CREATE INDEX CONCURRENTLY idx_orders_status_created_user ON orders (status, created_at DESC, user_id) WHERE status IN ('paid','shipped','delivered');

Composite (status, created_at DESC, user_id) covers the common dashboard query and lets the planner do an Index Scan + Limit without sorting.

Restricting the partial predicate keeps the index small (~840 MB vs ~3.2 GB on a full index against this row count).

Rollback

-- if it doesn't behave on staging DROP INDEX CONCURRENTLY idx_orders_status_created_user; -- ↓ no Access Exclusive lock; safe under traffic
P95 before1,820ms
P95 after4ms · -99.8%
Write cost+3.8ms / INSERT
Confidence0.91verified
Show extended notes · maintenance · monitoring · what NOT to do

VACUUM cadence is unaffected — partial indexes still get vacuumed by the standard autovacuum schedule. Bloat will track the active subset (currently ~7% of rows match the partial predicate). Re-evaluate the predicate set quarterly; if 'returned' enters the hot status set, add it to the index WHERE clause and re-issue with CONCURRENTLY.

What NOT to do: don't add a covering INCLUDE clause yet — the dashboard query selects 8 columns, which would push this index past 1 GB and start to hurt write amplification. Revisit if you add a read-replica.

Show comparable cases from the wall · QD-996, QD-1003, QD-1029

QD-996 · same shape on a smaller events table (2.1M rows). Partial index dropped p95 980ms → 6ms. They added INCLUDE later and were fine — write rate was 8/s.

QD-1003 · status set was wider (12 values, no clear hot subset). Recommended a full composite index instead — partial wasn't selective enough.

QD-1029 · similar query against a partitioned table. The recipe needs adjusting per partition; we generated a DDL for the active 7-day partition only.

SHEET 03 · LIVE WALL · LAST 14 DAYS

Twelve real reviews. Ship-receipts only.

N=237 THIS WEEK · PG 11–17
QD-1042 · ORDERS · PG15
Sequential scan on orders (12.4M rows) under status + created_at predicate.
Partial composite (status,created_at,user_id) WHERE status IN hot subset.
1,820 ms4 ms · -99.8%
Replaced btree(created_at) with partial composite. Index size: 3.2 GB → 840 MB.
QD-1041 · INVOICES · PG14
Per-row subquery probe blowing up planner cost on a category lookup.
CTE materialize WHERE category_id=47 once, JOIN against it.
680 ms42 ms · -94%
Lifted correlated subquery into a CTE. Planner stops re-probing the lookup.
QD-1040 · EVENTS · PG16
Append-only timestamp index ballooning to 4.2 GB on a high-write table.
BRIN on (created_at) with pages_per_range=64.
4.2 GB80 MB · -98%
Swapped btree → BRIN on append-only timestamps. Vacuum window unchanged.
QD-1039 · USERS · PG13
Case-insensitive email lookup forcing seq scan.
Expression index on lower(email); rewrite predicate to match.
1,200 ms2 ms · -99.8%
Expression index lower(email) + matching predicate. Login p95 dropped under 5 ms.
QD-1038 · DASHBOARD · PG15
Top-of-page aggregate hammering the read replica every page load.
Materialized view mv_dashboard_60min with REFRESH CONCURRENTLY.
2,400 ms36 ms · -98%
Pushed aggregate behind a 60-min materialized view. Replica CPU down 38%.
QD-1037 · pg_stat_statements · PG15
Top offender by total_time was an unnoticed stale background job.
Flagged for the on-call channel; cron killed; -38% read load org-wide.
28% of CPUflagged · paused
Identified stale cron via pg_stat_statements. Disabled — load floor reset.
QD-1036 · ANALYTICS · PG14
INDEX hint applied; planner ignored it; team thought hint was the fix.
Removed hint, ran ANALYZE; planner picked the right index unprompted.
340 ms12 ms · -96%
Stats were stale. ANALYZE refreshed pg_class.reltuples; hint became unneeded.
QD-1035 · LOGS · PG16
Daily partition pruning failed because the predicate cast to date.
Rewrite predicate to range-on-timestamp; remove ::date cast.
scan all parts1 partition · -97%
Removed ::date cast. Partition pruning re-engaged; one daily partition scanned.
QD-1034 · BILLING · PG15
Aurora replica lagging 4 s behind primary; queries hit primary anyway.
Identified two missing covering indexes — replica caught up in 90 s.
4 s lag120 ms · -97%
Two covering indexes added on hot tables. Replica WAL apply caught up in 90 s.
QD-1033 · PRODUCTS · PG13
JSONB attribute lookup with no GIN index. Generic query, brutal.
GIN jsonb_path_ops on attrs; rewrote predicate to @>.
2,100 ms14 ms · -99%
Added GIN(jsonb_path_ops). Predicate rewritten to @> — index now used.
QD-1032 · SESSIONS · PG14
SELECT COUNT(*) on a 60M-row table for a header badge.
Approximate count via pg_class.reltuples + 5-min refresh.
1,400 ms0.3 ms · -99.97%
Replaced exact COUNT(*) with reltuples poll. Tolerance acceptable for a badge.
QD-1031 · COMMENTS · PG15
Trigram search across 8 M comments without an index. Search-as-you-type was unusable.
GIN gin_trgm_ops on body; rewrote LIKE → ILIKE wrapped in %.
3,800 ms22 ms · -99%
Added GIN(gin_trgm_ops) on body. Search-as-you-type now under 25 ms.
SHEET 04 · THE ENGINE

Four stages. One verification pass.

REV. 2026-05 · 14% CAUGHT

Three input modes, one verification pass, a Git-ready diff. Every recommendation cites the EXPLAIN node it came from. Every migration ships with a rollback. About 14% of drafts never reach you — they get caught and rewritten by an independent verification step before the review URL goes live. Want proof first? See a full sample DBA review, then paste your own slow query into the analyzer.

Methodology. Analysis combines static EXPLAIN-plan heuristics — sequential scan vs. index scan detection, row-estimate error, sort spill, join order — with a reasoning pass validated against PostgreSQL 11–17 planner behavior. Index DDL is costed against the schema shape you submit, never an imagined database, and the pricing for unlimited reviews is flat.

Stage 01
Classify
Detect input shape — raw SQL, an EXPLAIN ANALYZE tree, or a pgBadger log slice. Route to the matching analysis chain. Reject prompts that look like incident triage.
~0.4s
Stage 02
Reason
Run the version-aware analysis chain (PG 11 → 17). Recipes for partial / expression / covering / BRIN / GIN / trigram. Cost the rewrite against the schema shape — never against an imagined database.
~14s
Stage 03
Verify
An independent verification pass re-reads the draft, checks the cited EXPLAIN nodes, and either approves or rewrites. Drafts caught here do not reach the customer. Roughly 14% of v1 drafts get sent back.
~9s · 14% caught
Stage 04
Ship
Markdown review at /r/QD-####. Stable URL, 90-day history, JSON export. Defaults: CREATE INDEX CONCURRENTLY, rollback included, AccessExclusive warnings surfaced above the recommendation, never buried.
26s avg
SHEET 05 · SUBSCRIPTION SCHEDULE

Card-free Free. Personal-card Solo.

EFFECTIVE 2026-05 · USD
Querk subscription tiers. Three columns: Free at $0/month, Solo at $49/month, and Team at $149/month (waitlist). Rows compare reviews per month, saved-history window, stable review URL, API key, Slack integration, SSO, drift alerts, and verification-pass coverage.
Feature Free$0 · forever Solo$49 / month Team$149 · waitlist
Reviews / month 3 Unlimited · 5 seats
Saved-history window 30 days 180 days · shared library
Stable review URL /r/QD-####
API key (CI integration) 10 req/sec · prioritized
Slack /qd
SSO · Google + Microsoft
Drift alerts on saved queries
Verification pass on every review
Run free Join waitlist

// Stripe-billed in USD. Cancel inside the dashboard, no email gauntlet. Charter rate locked for early subs.

SHEET 06 · NOTES & FAQ

Eight things engineers ask before they paste.

REV. 2026-06 · 8 ITEMS
Q · 01What is actually doing the analysis?+

A purpose-built Postgres review pipeline. Inputs are classified — SQL, EXPLAIN plan, or pgBadger log — and routed through a version-aware analysis chain with partial / expression / covering / BRIN / GIN / trigram recipes. An independent verification pass re-reads every draft before it ships. The pipeline is the product. The chat window is not.

Q · 02What leaves my network?+

SQL text, optionally a schema-only dump (pg_dump --schema-only), and pg_stat_statements rows. No customer rows, no PII. Query text is encrypted in transit, retained inside the 90-day audit window for paid plans (30 days for Free), and never used to train any third-party engine — the upstream providers we route through are contractually no-train for our org.

Q · 03Why not just hire a DBA consultant?+

You should — for a complex, ongoing engagement. For "this one query is slow and I want a senior opinion before I ship the index migration tomorrow," a $300–$600/hour consultant is the wrong tool. Querk is an order of magnitude cheaper for the bounded problem and an order of magnitude faster.

Q · 04Postgres versions and hosts?+

11 through 17. Reviews land for Aurora PG, RDS, Supabase, Neon, Heroku Postgres, and self-hosted. If you're on Citus, TimescaleDB, or AlloyDB, mention it in the input — the chain adjusts its recommendations accordingly.

Q · 05What if the recommendation is wrong?+

Two safeguards. First: every recommendation includes a confidence score and a "test on staging first" line. Second: if the fix doesn't behave, re-submit the post-deploy EXPLAIN ANALYZE and we iterate on the same review URL — the iteration counts as part of the same review, no extra credit consumed on Free.

Q · 06Where does the name come from?+

Querk = "query" + "quirk" — the small unexpected detail in your EXPLAIN plan that's actually slowing you down. The 5-letter spelling makes the .io domain easy to remember and types fast on mobile. We were briefly called QueryDoctor; querydoctor.io still 301-redirects here for stale bookmarks.

Q · 07Do I paste raw SQL or an EXPLAIN ANALYZE plan?+

Either works, and a plan is better. Raw SQL lets us reason about the shape; an EXPLAIN ANALYZE tree gives us the planner's actual row counts, loop counts, and timings — so we can tell a sequential scan the planner chose on purpose from an index scan it skipped because statistics were stale. If you can, run EXPLAIN (ANALYZE, BUFFERS) and paste the whole tree. The richer the plan, the tighter the index optimization and query performance tuning we can return.

Q · 08I don't know which query is slow. Where do I start?+

Start with pg_stat_statements. Sort by total_exec_time (or mean_exec_time for latency-sensitive endpoints), copy the top offender's normalized query text, and paste that. The pg_stat_statements workflow guide walks through the exact SQL for a small team. Once you know the worst query, an EXPLAIN plan on it tells us whether the fix is a missing index, a rewrite, or a stats refresh.

SHEET 06.1 · CONCIERGE BETA

First 30 teams · real query, free fix.

FORM · QD-INTAKE
Beta enrollment FORM · QD-INTAKE · REV. 2026-05

Submit your slowest query. We’ll return the review within 24 hours. Charter pricing locked at $49/mo for life if we confirm the fix shipped.